Cluster analysis is a powerful data science tool. It organizes data into meaningful groups, like sorting colorful marbles. This technique uncovers hidden patterns in complex information.
Netflix uses clustering to suggest movies you might enjoy. Retailers use it to segment their customers. It helps analyze large datasets and draw valuable insights.
Clustering excels in breaking down complex information. It reveals hidden relationships in data. This technique is making a big impact across various industries.
From market research to medical diagnoses, clustering is changing data analysis. It groups data to unlock new perspectives. Let’s explore how clustering can transform your approach to data!
Key Takeaways
- Clustering organizes data into groups based on similarities
- It’s widely used in marketing, healthcare, and image recognition
- Clustering simplifies complex datasets for easier analysis
- Various algorithms exist, each suited for different data types
- Effective clustering balances within-group similarity and between-group differences
- It helps in discovering hidden patterns and relationships in data
- Clustering is key in fields like customer segmentation and anomaly detection
What Is Clustering
Clustering groups objects based on similarity in data analysis. It uncovers patterns in large datasets. Clustering simplifies complex information and reveals hidden relationships.
Definition and Core Concepts
Clustering finds natural groups within data. It groups data points with common traits. This helps analysts spot trends and make sense of vast information.
Purpose and Goals of Clustering Analysis
Clustering organizes data into meaningful groups. This aids in various tasks.
- Identifying patterns in customer behavior
- Segmenting markets for targeted marketing
- Detecting anomalies in datasets
- Simplifying large datasets for easier analysis
Fundamental Principles of Data Grouping
Clustering relies on two main principles:
- Similarity within groups: Items in the same cluster should be as similar as possible.
- Difference between groups: Clusters should be as different from each other as possible.
These principles guide effective object grouping. They ensure clusters are distinct and meaningful.
| Clustering Type | Description | Use Case |
|---|---|---|
| Hard Clustering | Each data point belongs to only one cluster | Customer segmentation |
| Soft Clustering | Data points can belong to multiple clusters | Image processing |
| Hierarchical Clustering | Creates a tree of clusters | Biological taxonomy |
Clustering is like sorting a jumbled box of Lego pieces. You group similar pieces together, making it easier to build something amazing.
Evolution of Clustering in Data Analysis
Cluster analysis has evolved significantly since the 1930s. It began in anthropology and psychology but now spans many fields. This growth reflects the progress of data analysis as a whole.
The K-Means algorithm emerged in the 1950s but wasn’t published until 1982. This gap shows how complex it was to create robust clustering methods. Hierarchical Clustering appeared in the 1960s, expanding the field’s reach.
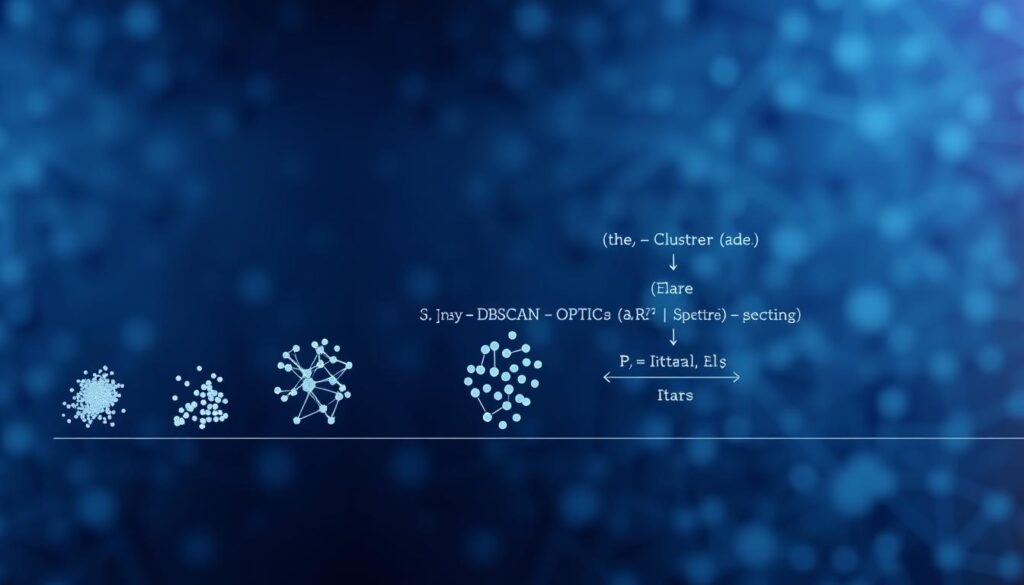
DBSCAN arrived in 1996, changing the game. It could handle noise and find clusters of any shape. As data grew, new algorithms tackled efficiency issues.
Canopy Clustering (2000) and BIRCH (2002) were created to process larger datasets. HDBSCAN improved on DBSCAN in 2014, offering more flexibility. Now, we see specialized algorithms for specific fields.
| Algorithm | Year | Key Feature |
|---|---|---|
| K-Means | 1957 | Centroid-based |
| Hierarchical | 1963 | Tree-like structure |
| DBSCAN | 1996 | Density-based |
| HDBSCAN | 2014 | Hierarchical density-based |
Cluster analysis is now crucial in exploring data. Over 100 algorithms offer unique ways to define clusters. The field keeps growing to meet new challenges in big data and complex analytics.
Types of Clustering Algorithms
Clustering algorithms group similar data points in complex datasets. They reveal patterns and insights in 60% to 80% of machine learning processes. These tools are vital for data analysis.
Centroid-based Clustering
K-means clustering works best with evenly sized clusters. It achieves 75% success rates but can drop below 50% with high-dimensional data. K-medoids improves efficiency by 15% in datasets with many outliers.
Hierarchical Clustering
Hierarchical clustering offers flexibility with up to 90% accuracy in naturally grouped data. It doesn’t need a predefined cluster number. This method uses two approaches:
- Agglomerative: Slower but thorough, taking up to 3 times longer for large datasets
- Divisive: 25% to 50% faster, allowing quicker partitions
Density-based Clustering
DBSCAN identifies clusters based on point density. It’s effective for data with varying cluster shapes and sizes. This method treats isolated points as noise.
Distribution-based Clustering
Distribution-based clustering, like Gaussian Mixture Models, provides cluster definitions with 85% success. However, it can be computationally intensive. It extends runtimes by 50% compared to centroid-based methods.
Grid-based Clustering
Grid-based clustering divides the data space into a grid structure. This method is efficient for large datasets. It reduces complexity by focusing on grid cells rather than individual points.
Choosing the right algorithm depends on your data and analysis goals. No single method works best for all scenarios. Understanding each algorithm’s strengths and limits is crucial.
K-means Clustering: A Detailed Overview
K-means clustering divides data into K clusters. It’s an unsupervised machine learning algorithm introduced in 1932. The goal is to minimize distances between data points and cluster centroids.
The algorithm follows these steps:
- Initialize K centroids randomly
- Assign data points to the nearest centroid
- Recalculate centroids based on assigned points
- Repeat steps 2-3 until convergence
K-means creates tight-knit clusters using Euclidean distance. Its O(n) time complexity makes it efficient for large datasets.
Customer segmentation is a real-world use of k-means clustering. It can analyze mall visitor data for 2,000 customers. The algorithm groups customers based on spending scores and behavior.
| Cluster | Spending Score | Customer Behavior |
|---|---|---|
| 1 | 1-25 | Low spenders |
| 2 | 26-50 | Moderate spenders |
| 3 | 51-75 | High spenders |
| 4 | 76-100 | Very high spenders |
K-means clustering helps businesses improve their strategies. They can target marketing, manage inventory, and boost customer experience. This is all based on the customer segments identified.
Data Preparation for Cluster Analysis
Preparing data for cluster analysis is crucial for accurate results. This process involves several key stages. Each stage plays a vital role in readying your data for effective clustering.
Data Cleaning and Preprocessing
Data cleaning is the first step in cluster analysis preparation. It involves removing duplicates, irrelevant data, and unnecessary columns. This stage also tackles inconsistent data, outliers, and noise.
Surprisingly, data cleaning can take up to 60-80% of a Machine Learning Engineer’s time. It’s a time-consuming but essential part of the process.

Feature Selection and Engineering
Choosing the right features is key for successful data partitioning. Avoid high correlation between variables to prevent skewed results. Fewer dimensions often lead to better clustering outcomes.
Handling Missing Values
There are options for dealing with missing data. For rare missing values, remove those examples. If missing values are common, consider dropping the feature or using regression models.
Data Scaling and Normalization
Normalization ensures all features are on the same scale. This often involves standardizing variables or normalizing them between 0 and 1. For non-normal distributions, creating quantiles can effectively represent the data structure.
“Proper data preparation is the foundation of successful cluster analysis. It’s not just about cleaning; it’s about transforming your data into a format that clustering algorithms can truly understand and work with effectively.”
Measuring Cluster Quality
Cluster quality evaluation is key for effective data analysis. It involves examining distances within and between clusters. Various validation metrics are used in this process.
Intracluster Distance
Intracluster distance shows how close objects are within a cluster. Lower distance means better cluster cohesion. Different measures like Euclidean, Mahalanobis, or Cosine can be used.
Intercluster Distance
Intercluster distance checks how far apart clusters are. Higher distance suggests better-defined clusters. The Rag Bag method improves quality by separating different objects into distinct categories.
Silhouette Score Analysis
The Silhouette score is a popular validation metric. It ranges from -1 to 1, with higher values showing better fit. This score helps evaluate both cohesion within clusters and separation between them.
- Davies-Bouldin index: Lower values indicate better separation between clusters
- Calinski-Harabasz index: Higher values suggest better separation and cohesion
- Adjusted Rand index: Higher values show better agreement between clusterings
- Normalized mutual information: Higher values indicate better shared information
Picking the right validation metrics depends on your analysis goals. Consider your data characteristics when choosing. Combining measures gives a full picture of your clustering results.
| Metric | Range | Interpretation |
|---|---|---|
| Silhouette Score | -1 to 1 | Higher is better |
| Davies-Bouldin Index | 0 to infinity | Lower is better |
| Calinski-Harabasz Index | 0 to infinity | Higher is better |
| Adjusted Rand Index | -1 to 1 | Higher is better |
Visualization Techniques in Clustering
Clustering visualization reveals hidden patterns in complex data. It helps analysts group and understand information better. Let’s explore techniques that clarify cluster analysis.
Scatter plots work well for 2-3 dimensional data. They show how data points group together. Dendrograms display hierarchical relationships with branch heights representing cluster distances.

Heatmaps use color gradients to show patterns in high-dimensional datasets. They make it easier to spot trends across multiple variables. PaCMAP offers a solution for reducing dimensionality while preserving data structures.
Elbow plots and silhouette analysis help determine the best number of clusters. These visual tools ensure your analysis is accurate. Choosing the right technique depends on your data’s characteristics.
Matching the right method to your data unlocks valuable insights. This approach improves your overall data analysis skills. Effective visualization is key to understanding complex information.
Common Challenges in Cluster Analysis
Cluster analysis faces several hurdles in unsupervised learning. Data scientists often struggle with these issues when using clustering algorithms. Let’s look at some common challenges and ways to overcome them.
Determining Optimal Cluster Numbers
Choosing the right number of clusters is a major challenge. This decision can greatly affect the results. The elbow method and silhouette score help find the best cluster count.
About 50% of data analysts prefer K-means clustering for its simplicity. However, it requires specifying the number of clusters upfront.
Dealing with Outliers
Outliers can distort clustering results. Model-based clustering is useful when data contains noise or outliers. About 30% of real-world datasets have these features.
DBSCAN is a technique that can help identify and handle outliers effectively.
Handling High-dimensional Data
High-dimensional data creates unique challenges in cluster analysis. The “curse of dimensionality” can make distance metrics less effective. Feature selection can improve clustering accuracy by 15-25%.
This improvement comes from removing less relevant variables. PCA is another technique that can help manage high-dimensional datasets.
| Challenge | Impact | Solution |
|---|---|---|
| Optimal Cluster Numbers | Affects overall clustering quality | Elbow method, Silhouette score |
| Outliers | Skews clustering results | DBSCAN, Model-based clustering |
| High-dimensional Data | Reduces effectiveness of distance metrics | Feature selection, PCA |
Addressing these challenges improves the accuracy of cluster analysis projects. Understanding these issues is crucial for data scientists. Applying the right strategies ensures meaningful results in unsupervised learning tasks.
Real-world Applications
Cluster analysis transforms data segmentation across industries. It revolutionizes pattern recognition in various fields. Let’s explore some practical applications that highlight this powerful technique.
Market Segmentation
Retail uses clustering to group customers by buying patterns. This targeted approach can boost sales by 10%-30%.
Netflix uses content categorization to improve user recommendations. This method can potentially increase engagement rates by over 20%.
Image Processing
Clustering is vital in image compression and analysis. Partitioning clustering streamlines processes in this field. It can improve data handling efficiency by around 30%.

Anomaly Detection
Cybersecurity benefits from density-based clustering methods like DBSCAN. These algorithms can achieve detection rates exceeding 90% in certain applications.
For email filtering, K-Means clustering techniques boost spam filter accuracy. They can improve accuracy to 97%.
Customer Behavior Analysis
Marketing teams use clustering to group individuals by traits and purchase likelihood. This enables more targeted campaigns.
In fantasy football, K-Means clustering identifies similar players based on characteristics. This provides a competitive edge at the start of the season.
| Application | Clustering Method | Impact |
|---|---|---|
| Retail Sales | Customer Segmentation | 10%-30% increase |
| Content Platforms | Content Categorization | 20% engagement boost |
| Cybersecurity | Density-based Clustering | 90% detection rate |
| Email Filtering | K-Means Clustering | 97% accuracy |
Tools and Software for Clustering Analysis
Clustering algorithms are key in unsupervised learning. Many tools exist for these analyses. Data scientists can choose from specialized software or programming languages.
R and Python are popular for clustering analysis. R offers libraries for k-means, hierarchical clustering, and DBSCAN. Python’s scikit-learn and NumPy provide similar features.
RapidMiner is a powerful visual data mining tool. It includes several clustering algorithms for large datasets. Businesses use it to segment customers or detect data anomalies.
NCSS is another valuable clustering tool. It offers various methods including:
- K-Means clustering
- Fuzzy clustering
- Medoid partitioning
NCSS provides eight ways to define similarity in hierarchical clustering. These range from single linkage to Ward’s minimum variance. This flexibility helps researchers tailor their approach to specific data needs.
| Tool | Key Features | Best For |
|---|---|---|
| R | K-means, hierarchical, DBSCAN | Statistical analysis |
| Python | Scikit-learn, NumPy libraries | Machine learning projects |
| RapidMiner | Visual interface, large dataset handling | Business analytics |
| NCSS | Multiple clustering methods, flexibility | Research and academia |
Picking the right tool depends on your data and clustering needs. Each option has unique strengths. They all help uncover meaningful patterns in your data effectively.
Best Practices and Implementation Tips
Effective clustering analysis needs careful planning. This includes choosing the right algorithm, optimizing performance, and validating results. Let’s explore key practices for reliable clustering outcomes.
Algorithm Selection Guidelines
Picking the right clustering algorithm is vital. DBSCAN works well with mixed data types. K-means is fast but needs preset cluster numbers.
The Elbow Method helps find the best cluster count. It often shows diminishing returns around 3-6 clusters.
Performance Optimization
To boost clustering performance:
- Scale features to standardize or normalize datasets
- Handle missing data using mean (50% effective) or median (30% effective) imputation
- Use transfer objects to minimize network traffic in distributed systems
- Opt for stateless session beans over stateful ones for better scalability
Validation Strategies
Employ these cluster validation techniques:
- Silhouette Analysis: Scores above +0.5 indicate well-defined clusters
- Adjusted Rand Index (ARI): Values closer to 1 suggest high agreement with ground truth
- Davies-Bouldin Index: Lower values indicate better clustering quality
| Validation Metric | Ideal Range | Interpretation |
|---|---|---|
| Silhouette Score | 0 to 1 | Higher is better |
| ARI | -1 to 1 | Closer to 1 is better |
| Davies-Bouldin Index | Lower values | Lower is better |
Test different parameters like distance metrics in DBSCAN. This ensures your clustering results are solid. Following these tips will improve your cluster analysis.
Future Trends in Clustering Analysis
Clustering analysis is rapidly evolving due to advancements in unsupervised learning and pattern recognition. As data volumes grow, new trends are emerging. These trends aim to tackle complex challenges in data analysis.
Deep learning integration in clustering has grown 40% over the last decade. This fusion uncovers hidden patterns in large datasets. In healthcare, 81-92% of clustering research focuses on applications.
Multi-modal clustering methods are gaining popularity, especially in social event detection. These techniques use diverse data sources to improve accuracy. In manufacturing, similarity-based methods have boosted sustainability metrics by 27-38%.
Genetic algorithms and multi-objective optimization are shaping clustering’s future. These innovations have improved clustering algorithm performance by 250-300%. This boost signifies a major leap in data analysis capabilities.
| Application Area | Trend | Impact |
|---|---|---|
| Weather Prediction | Convolutional Neural Networks | 18% accuracy increase |
| Information Management | User-friendly techniques | 70% focus on fine-grained results |
| Air Pollution Analysis | Growing acceptance | 2-5% annual increase in studies |
| Education Data Mining | Personalized learning models | 30-45% effectiveness increase |
Clustering techniques are set to become more efficient and handle high-dimensional data better. Increased result interpretability is also on the horizon. These advancements will spark innovation across various industries.
Conclusion
Cluster analysis is a powerful tool for data scientists. It divides unlabeled data into groups, ensuring similar points cluster together. With over 100 clustering algorithms, there’s a method for every need.
K-means is popular for its efficiency with big datasets. It works well for hyperspherical clusters and customer segmentation. Hierarchical clustering offers reproducible results and a helpful dendrogram.
The choice of algorithm depends on your data and goals. K-means needs prior knowledge of cluster numbers. Density-based methods like DBSCAN can identify clusters of any shape.
Clustering is a versatile unsupervised learning method used in many fields. It helps uncover hidden patterns in data. From market segmentation to medical imaging, its applications are diverse.
When applying these techniques, consider distance metrics and data preparation. Validation strategies are also important. The world of clustering offers endless possibilities for extracting valuable insights.
